Every PE interview includes some version of the paper LBO. You'll be given basic information about a company and asked to calculate returns without a computer. The candidates who get offers can do this confidently in 10 minutes or less.
Here's the exact framework, worked examples, and shortcuts you need to master.
What is a Paper LBO?
A paper LBO is a simplified leveraged buyout analysis done by hand. You'll receive:
- Purchase price or EBITDA multiple
- Entry EBITDA
- Debt structure (leverage ratio or dollar amounts)
- Holding period
- Exit assumptions (multiple or EBITDA growth)
Your job: Calculate the equity return (IRR and/or MOIC).
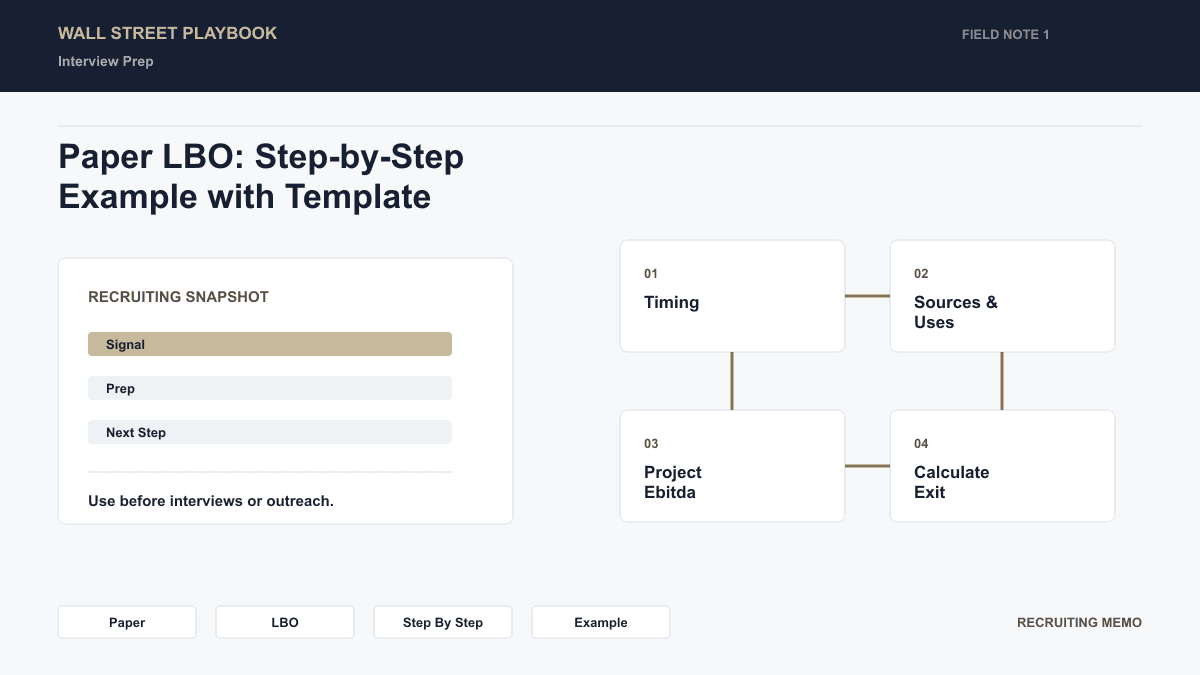
The Framework: 5 Steps, 10 Minutes
Step 1: Calculate Purchase Price and Sources & Uses (1-2 min)
Formula: Purchase Price = Entry EBITDA × Entry Multiple
Sources = Uses
- Uses: Purchase price (+ sometimes fees, but often ignored in paper LBOs)
- Sources: Debt + Equity
Example:
- Entry EBITDA: $100M
- Entry Multiple: 10x
- Leverage: 5x EBITDA (debt)
Purchase Price = $100M × 10x = $1,000M Debt = $100M × 5x = $500M Equity = $1,000M - $500M = $500M
Step 2: Project EBITDA Growth (1-2 min)
Apply the growth rate for each year.
Example: 5% annual EBITDA growth over 5 years
| Year | EBITDA |
|---|---|
| 0 | $100M |
| 1 | $105M |
| 2 | $110M |
| 3 | $116M |
| 4 | $122M |
| 5 | $128M |
Shortcut: For 5% growth over 5 years, EBITDA grows by roughly 28% total. For quick math: $100M × 1.28 = $128M.
Step 3: Model Debt Paydown (2-3 min)
In paper LBOs, assume all excess cash flow pays down debt. The simplest assumption: FCF ≈ EBITDA (or you'll be given a conversion factor).
If you're given: "Assume 50% of EBITDA converts to free cash flow for debt paydown."
Example: 50% EBITDA conversion
| Year | EBITDA | FCF (50%) | Cumulative Debt Paydown |
|---|---|---|---|
| 1 | $105M | $52.5M | $52.5M |
| 2 | $110M | $55M | $107.5M |
| 3 | $116M | $58M | $165.5M |
| 4 | $122M | $61M | $226.5M |
| 5 | $128M | $64M | $290.5M |
Ending Debt = Starting Debt - Total Paydown $500M - $290.5M = $209.5M (round to $210M)
Shortcut: Average EBITDA ≈ $115M. 5 years × $115M × 50% = $287.5M debt paydown. Close enough for paper math.
Step 4: Calculate Exit Value and Equity Proceeds (2-3 min)
Exit Enterprise Value = Exit EBITDA × Exit Multiple
Exit Equity Value = Exit EV - Remaining Debt
Example:
- Exit EBITDA: $128M
- Exit Multiple: 10x (same as entry)
- Remaining Debt: $210M
Exit EV = $128M × 10x = $1,280M Exit Equity = $1,280M - $210M = $1,070M
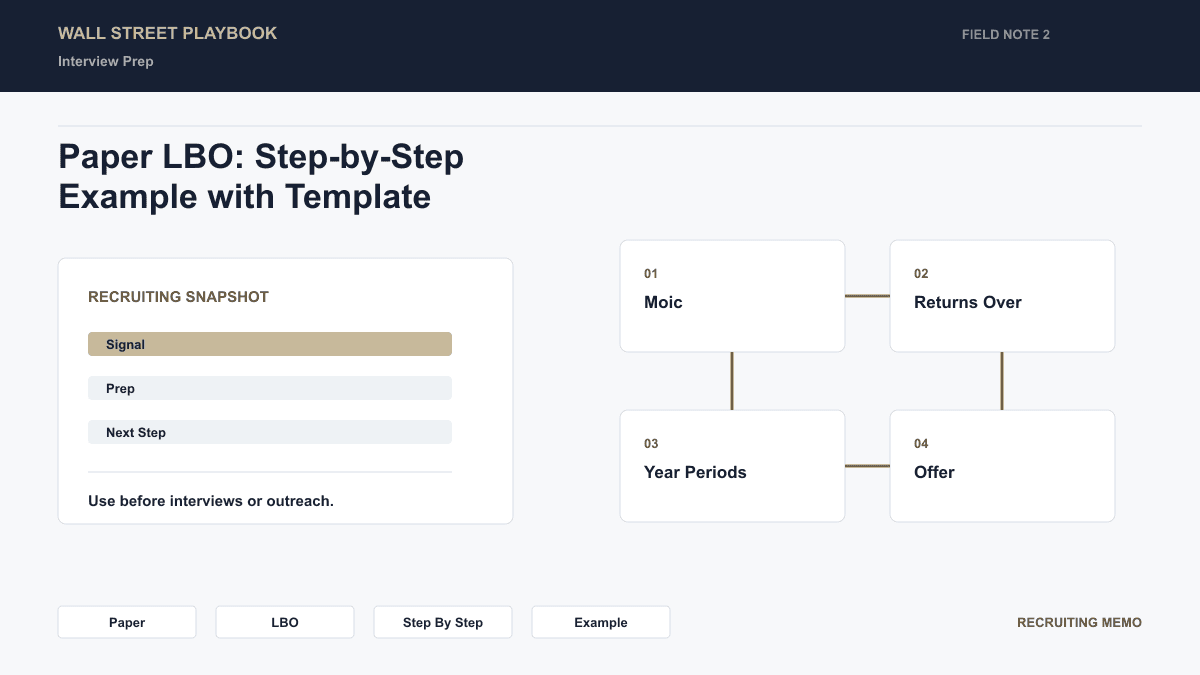
Step 5: Calculate Returns (1-2 min)
MOIC (Multiple of Invested Capital): MOIC = Exit Equity / Entry Equity MOIC = $1,070M / $500M = 2.14x
IRR (Internal Rate of Return): Use the Rule of 72 or memorized benchmarks.
For a 5-year hold:
- 2x MOIC ≈ 15% IRR
- 2.5x MOIC ≈ 20% IRR
- 3x MOIC ≈ 25% IRR
Our 2.14x over 5 years ≈ 16-17% IRR
More precise IRR formula (for math lovers): IRR = (MOIC)^(1/years) - 1 IRR = (2.14)^(1/5) - 1 = 16.4%
Get the paper LBO template
Download the free template and use it alongside your PE interview prep.
No spam. Unsubscribe anytime.
Complete Worked Example
The Prompt
"A PE firm is acquiring TargetCo for 8x EBITDA. Entry EBITDA is $50M. They're using 4x leverage. EBITDA grows 10% annually. Assume 60% of EBITDA converts to FCF for debt paydown. 5-year hold, exit at 8x. Calculate the IRR."
The Solution
Step 1: Sources & Uses
- Purchase Price: $50M × 8x = $400M
- Debt: $50M × 4x = $200M
- Equity: $400M - $200M = $200M
Step 2: EBITDA Projection 10% annual growth over 5 years:
- Year 0: $50M
- Year 5: $50M × 1.61 = $80.5M (using 1.1^5)
Step 3: Debt Paydown Average EBITDA ≈ $65M (midpoint between $50M and $80M) Annual FCF ≈ $65M × 60% = $39M Total debt paydown ≈ $39M × 5 = $195M
Remaining debt = $200M - $195M = $5M (nearly paid off!)
Step 4: Exit Value
- Exit EBITDA: $80.5M
- Exit EV: $80.5M × 8x = $644M
- Exit Equity: $644M - $5M = $639M
Step 5: Returns
- MOIC: $639M / $200M = 3.2x
- IRR: 3x over 5 years ≈ 25%, so 3.2x ≈ 26% IRR
IRR Cheat Sheet
Memorize these benchmarks for quick mental math:
| MOIC | 3-Year IRR | 4-Year IRR | 5-Year IRR |
|---|---|---|---|
| 1.5x | 14% | 11% | 8% |
| 2.0x | 26% | 19% | 15% |
| 2.5x | 36% | 26% | 20% |
| 3.0x | 44% | 32% | 25% |
| 3.5x | 52% | 37% | 28% |
The Rule of 72: To double your money, 72 / IRR = years. So 15% IRR ≈ 4.8 years to double.
LBO Value Creation: The Four Levers
When asked "how does PE create value?" or "what drives returns in this LBO?", cite these four levers:
1. Leverage (Financial Engineering)
More debt = less equity = higher percentage returns (if things go well). In our example, 4x leverage meant we only put in $200M for a $400M company.
2. EBITDA Growth
Revenue growth and/or margin expansion increase the value of the business. In our example, 10% annual growth drove EBITDA from $50M to $80.5M.
3. Multiple Expansion
Selling at a higher multiple than you paid increases returns. If we exited at 9x instead of 8x, exit equity would be $725M (3.6x MOIC) instead of $639M (3.2x).
4. Debt Paydown
As debt is repaid, more enterprise value accrues to equity holders. We paid down $195M of debt, which all went to equity value.
Sensitivity Analysis: What to Mention
After solving the base case, interviewers often ask about sensitivities. Know how to discuss:
Entry multiple sensitivity: "If we paid 7x instead of 8x, our entry equity would be $150M instead of $200M, improving returns significantly."
Exit multiple sensitivity: "Each turn of exit multiple is worth roughly $80M in this case (exit EBITDA). At 9x exit, we'd generate $725M vs $639M at 8x."
Leverage sensitivity: "Higher leverage magnifies returns but increases risk. At 5x debt instead of 4x, our equity check would be $150M, but we'd need stronger cash flows to service the debt."
Growth sensitivity: "If EBITDA only grows 5% instead of 10%, exit EBITDA would be ~$64M, and returns would compress to roughly 2x MOIC."
Recommended Resource
The Paper LBO Playbook
78 pages. Timed paper LBO setup, mental math shortcuts, return bridges, worked examples, and practice drills.
Common Mistakes to Avoid
Mistake 1: Forgetting to Subtract Debt at Exit
A common error is calculating exit EV but forgetting to subtract remaining debt to get equity value. The question is always about equity returns, not EV returns.
Mistake 2: Over-Complicating the Math
Paper LBOs test concepts, not Excel skills. Round numbers aggressively. $117M becomes $120M. You're not graded on decimal precision.
Mistake 3: Confusing MOIC and IRR
MOIC tells you "how much did I make?" IRR tells you "how fast did I make it?" A 3x MOIC over 3 years is very different from 3x over 10 years.
Mistake 4: Ignoring Cash Flow Constraints
If debt interest exceeds cash flow, the company can't service its debt. In paper LBOs this is often simplified away, but mention you'd check debt service capacity in a real model.
Mistake 5: Not Articulating the Drivers
After calculating returns, explain what's driving them: "The 26% IRR is driven primarily by EBITDA growth (60% of the EBITDA increase) and debt paydown (nearly full paydown over 5 years)."
Quick Mental Math Tricks
Compound growth shortcut:
- 5% growth for 5 years ≈ 28% total
- 10% growth for 5 years ≈ 61% total
- 5% growth for 3 years ≈ 16% total
- 10% growth for 3 years ≈ 33% total
Multiple to IRR conversion (5 years):
- 2x ≈ 15% IRR
- 2.5x ≈ 20% IRR
- 3x ≈ 25% IRR
Average shortcut: For a growing series, the midpoint of start and end is close to the average. Use this for debt paydown calculations.
Practice Problems
Problem 1
Entry EBITDA: $75M Entry Multiple: 9x Leverage: 4.5x EBITDA Growth: 8% annually FCF Conversion: 50% Hold Period: 5 years Exit Multiple: 9x
Answer: Purchase = $675M, Debt = $337.5M, Equity = $337.5M. Exit EBITDA ≈ $110M. Exit EV = $990M. Debt paydown ≈ $232M. Remaining debt ≈ $105M. Exit Equity ≈ $885M. MOIC = 2.6x. IRR ≈ 21%.
Problem 2
Entry EBITDA: $200M Entry Multiple: 7x Leverage: 3x EBITDA Growth: 5% annually FCF Conversion: 70% Hold Period: 4 years Exit Multiple: 8x
Answer: Purchase = $1,400M, Debt = $600M, Equity = $800M. Exit EBITDA ≈ $243M. Exit EV = $1,944M. Debt paydown ≈ $625M. Remaining debt ≈ 0 (paid off). Exit Equity ≈ $1,944M. MOIC = 2.4x. IRR ≈ 25%.
Problem 3 (Multiple Expansion)
Entry EBITDA: $100M Entry Multiple: 10x Exit Multiple: 12x Leverage: 5x EBITDA Growth: 0% (flat) FCF Conversion: 60% Hold Period: 5 years
Answer: Purchase = $1,000M, Debt = $500M, Equity = $500M. Exit EBITDA = $100M. Exit EV = $1,200M. Debt paydown = $300M. Remaining debt = $200M. Exit Equity = $1,000M. MOIC = 2x. IRR ≈ 15%. (Returns driven entirely by multiple expansion and debt paydown, not growth.)
Get the Printable Cheat Sheet
Want this entire framework in a printable format? Download the Free Paper LBO Template, includes the IRR cheat sheet, quick math shortcuts, and 3 additional practice problems with solutions.
Related Reading
- LBO Model Walkthrough: 5 Steps, The full LBO framework with return driver analysis
- Accretion/Dilution Analysis Explained, The other major deal type for IB interviews
- Walk Me Through a DCF, The valuation framework that complements LBO analysis
Want the full timed system? The Paper LBO Playbook gives you 78 pages of worked examples, mental math shortcuts, return bridges, and practice drills for PE case screens.
Preparing for PE interviews? The 2026 PE Recruiting Playbook covers everything from headhunter strategy to technical prep.